
U.S. stocks just had their worst month since March 2020 and are ending a third straight quarter down for the first time since 2009 (Bloomberg). The meteoric rise of the markets between mid-June and mid-August has been erased and we are back to where we were in mid-June, at least for U.S. stocks. The scenario is a bit more mixed in bonds; Canadian bonds are still up from mid-June, while global and U.S. bonds are down slightly.
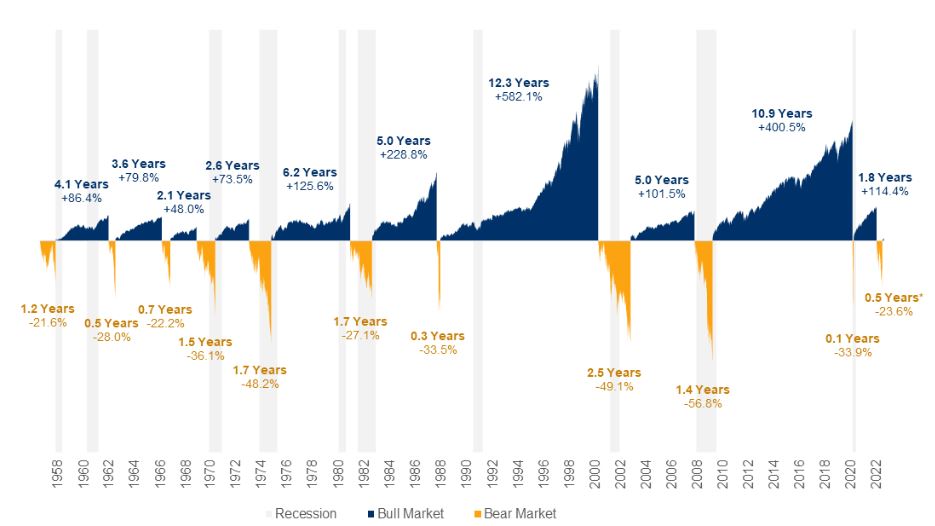
It’s a bleak picture for the first nine months of the year, and since we haven’t had a prolonged period of decline in a long time, some are wondering if such a long period of decline is normal. In fact, if we look at the long term, we quickly notice that the current decline, which has lasted for about 9 months now, is not particularly abnormal. However, what we do notice is that the last such decline that is freshest in our memory is that of March 2020. That was the one that was abnormal because of its very short duration. Going back a bit further, we quickly notice that historical declines are usually closer to what we are experiencing now than the one in 2020. This chart is a good illustration of bull and bear markets through the years, as well as their durations and associated returns (as of June 15, 2022). We can’t draw any conclusions with this data, but it does help us put the current 9-month period (0.75 year) in context with past bear markets (-20%). The good news in looking at this chart is that the bull markets are usually much longer and larger than the bear markets, hence the long-term appeal of investing in the financial markets.
Why should I stay invested if my investment goes down?
It’s a good question and one worth asking. The answer is simply that no one knows exactly when things will pick up. As presented in my July 2022 commentary (see here), there have been several occasions already this year where we could have believed that the markets were headed in the right direction, but we would have been wrong so far. By trying to predict if each time was the right time, we would have ended up hurting the portfolio even more by missing a lot of the upside and taking the downside. Let’s just imagine an investor who pulls out of the markets after the first few months of the year and then comes back when the markets have recovered 10% (so the investor has not recovered that 10%) believing that the timing is better, then the markets fall again. The investor exits the market once more. He then comes back in August after the 15%+ rally (which he did not take advantage of) and the markets fall again. This investor is in much worse shape than the one who stayed invested through the entire period. This answers the question I often get about why stay invested when the markets go down. We know the markets will eventually go up; we just don’t know when. And by the time we know they have finally turned the corner; the rally will already be well underway.
About September 2022
September started off relatively well, but very bad U.S. inflation data (AP) released on September 13 tipped the scales; with the U.S. stock market having its worst day since 2020 (Bloomberg). High inflation data led investors to believe that a 1% increase in the U.S. central bank’s key interest rate was in the cards for the meeting scheduled for the following week (an increase that will not materialize as the FED chose to go with 0.75% instead).
About a week later, a second blow to the markets when the FED (US central bank) announced its decision. However, the bad news did not come from the interest rate hike as such (0.75%), but from the “dot plot”. What is this “dot plot” that had such a big impact on the markets? It is in fact the forecasts of the members of the US central bank regarding the future of interest rates. This is where the real surprise was hidden. Indeed, the outlook presented at that time was much higher than the last one, which implied a continued rise and maintenance of restrictive monetary policies in the future. This led to a sharp rise in future interest rates on the market which, as you now know, led to a decline in both stocks and bonds.
On our side of the border, the news was a little better on the inflation front. The Canadian inflation data released during September was encouraging since, unlike our neighbors to the south, we could see signs of a reduction in inflation across most categories. As a result, the Canadian stock market outperformed its U.S. counterpart, a trend we have seen since the beginning of the year.
Looking ahead to the last quarter of 2022
Now that the third quarter is over, we turn our attention to the fourth and final quarter of 2022. Once again, there are many things to watch for in the last three months of the year, including of course inflation, the economic situation, elections and more. Another busy schedule, but hopefully one that will give us more positive news.
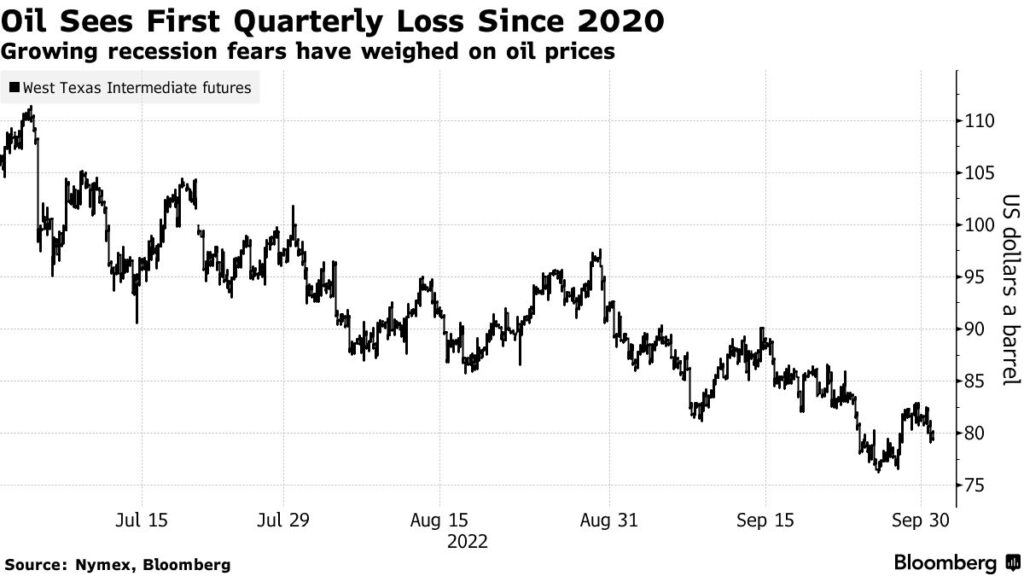
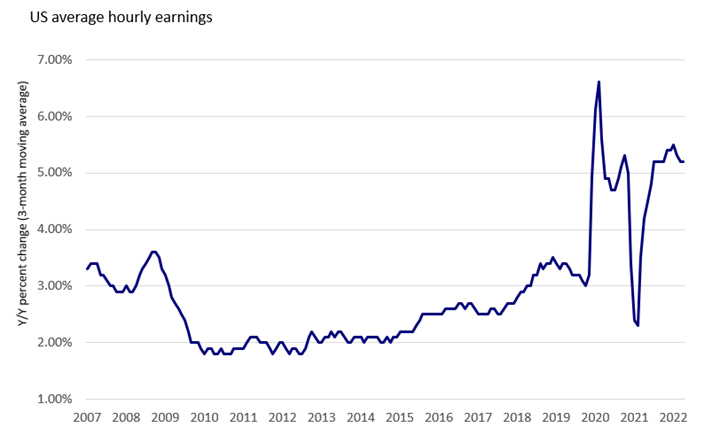
It will be interesting to see if August’s inflation data was just an aberration or if it will be really anchored. If it was just an outlier, that would of course be great news for the markets. There is still some data pointing to lower inflation in the future, but as discussed in my last comments (see here), we will need to see a trend to conclude that the decline is here to stay. The price of oil fell nearly 25% during the quarter, its first quarterly decline since 2020, and wages appear to have peaked (although this data is only very recent). We also started to hear more cautious comments from some Fed officials about rate hikes and their impacts, an encouraging sign that could lead to a less aggressive approach that would be well received by the markets (CNBC).
In Canada, the latest data gives hope for the downward trajectory of the CPI (consumer price index, a measure of inflation). If the trend continues, the Bank of Canada may be tempted to reduce the speed of its interest rate hikes or even the terminal (maximum) rate since the last few hikes seem to have already taken hold. I would not be surprised if the Bank of Canada’s terminal rate is lower than that of the U.S. central bank given the higher interest rate sensitivity of the Canadian economy relative to the U.S. economy.
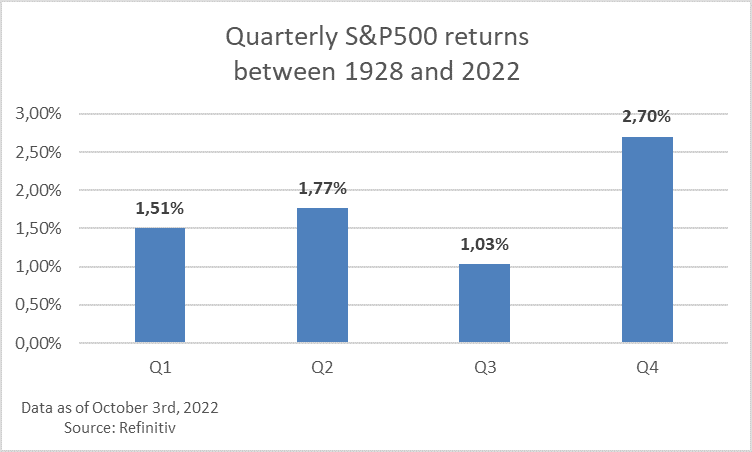
To end on a positive note, here is an historical context of the U.S. stock market returns through the various quarters of the year. I had fun (to each his own!) pulling up the S&P500 return data between 1928 and 2022 to see historically what the returns were for the different quarters. You may be pleased to know that we just finished the worst quarter of historical returns and are starting the best. Of course, past returns are no guarantee of future returns, but a little positivism can only do good this year.
Do not hesitate to contact me to share your comments and/or questions.